
Isolation of Chemical Constituents from Athyrium yokoscense and Their Inhibitory Effects on Nitrite Accumulation in LPS-Stimulated BV2 Microglial Cells
Abstract
Three phloroglucinol derivatives, aspidinol B (1), aspidinol P (2), and methylene-bis-aspidinol B (3), together with one flavonoid, angophorol (4), were isolated from Athyrium yokoscense (Athyriaceae). The isolated compounds were evaluated for their effects on extracellular nitrite accumulation, an indirect index of nitric oxide production, in lipopolysaccharide-stimulated BV2 cells. The IC50 values for compounds 1, 2, and 3 were 34.8, 55.4, and 70.0 μM, respectively, whereas that for compound 4 exceeded 100 μM. Immunoblot analysis showed lower inducible nitric oxide synthase and cyclooxygenase-2 protein abundance after treatment with compound 1. Compound 2 reduced cyclooxygenase-2 abundance without a comparable reduction in inducible nitric oxide synthase. Compound 1 was associated with lower c-Jun N-terminal kinase phosphorylation at 100 and 200 μM and a pronounced reduction in extracellular signal-regulated kinase phosphorylation at 200 μM. p38 phosphorylation was not comparably suppressed. These findings identify aspidinol B and aspidinol P as constituents with inhibitory effects on nitrite accumulation and support further evaluation in primary or human-derived microglial models.
Keywords:
Fern, Athyrium yokoscense, Athyriaceae, Microglia, Anti-inflammatoryIntroduction
Microglia are resident immune cells distributed throughout the brain and spinal cord and play key roles in immune surveillance and homeostasis within the central nervous system (CNS).1,2 They continuously monitor the neural microenvironment, clear cellular debris, support synaptic remodeling, and coordinate responses to infection and tissue injury.3,4 These functions are protective when appropriately regulated. However, persistent or dysregulated microglial responses can exacerbate oxidative and nitrosative stress, inflammatory cytokine signaling, and neuronal injury.5 This dual role makes microglia relevant to both the maintenance of brain homeostasis and the progression of chronic neurological diseases, including Alzheimer’s disease (AD), Parkinson’s disease (PD), and amyotrophic lateral sclerosis (ALS).6,7
Lipopolysaccharide (LPS) activates Toll-like receptor 4 (TLR4)-dependent innate immune signaling and is widely used to induce reproducible inflammatory responses in microglial models.8,9 In murine BV2 microglial cells, LPS activates nuclear factor kappa B (NF-κB) signaling and the ERK, JNK, and p38 mitogen-activated protein kinase (MAPK) pathways, thereby increasing the expression of inducible nitric oxide synthase (iNOS) and cyclooxygenase-2 (COX-2).10 Sustained production of iNOS-derived nitric oxide (NO) contributes to nitrosative stress and can promote neuronal injury under prolonged inflammatory conditions.11,12 Accordingly, LPS-stimulated BV2 cells provide a useful experimental model for evaluating compounds that suppress excessive microglial inflammatory responses.
Ferns are chemically diverse sources of phloroglucinols, flavonoids, and other specialized metabolites. Studies of Dryopteris species have identified phloroglucinols with antitumor-promoting activity, whereas extracts and flavonoids from medicinal ferns have shown antioxidant, antibacterial, and acetylcholinesterase-inhibitory activities.13–15 As metabolite profiles and biological activities vary among fern taxa, these observations underscore the importance of species-specific phytochemical and biological investigation. Dryopteris belongs to Dryopteridaceae and Athyrium to Athyriaceae, both within the fern order Polypodiales, as recognized by the Pteridophyte Phylogeny Group classification.16
Athyrium yokoscense (Athyriaceae) is an East Asian fern distributed in Korea, Japan, and China. Previous phytochemical studies of this species reported the phytoecdysteroid 24-epi-pterosterone from its roots, together with phenylpentanoic acids that showed ion-transport activity.17,18 More recently, an extract of A. yokoscense was reported to suppress COX-2 expression, ERK1/2 and NF-κB signaling, and inflammatory mediator production in bisphenol A-stimulated A549 lung adenocarcinoma cells.19 However, these extract-level findings do not establish the biological activities of individual A. yokoscense constituents in microglia.
In the present study, we describe the isolation and structural characterization of aspidinol B, aspidinol P, methylene-bis-aspidinol B, and angophorol and evaluate the effects of these compounds on LPS-induced nitrite accumulation, iNOS and COX-2 protein expression, and MAPK phosphorylation in BV2 cells.
Experimental
Plant material – A. yokoscense samples were collected from the Nambu Experimental Forest of Seoul National University, Baegun Mountain, Gwangyang, Jeollanam-do, Korea. A voucher specimen (SNU 980) was deposited at Seoul National University. Whole plants were freeze-dried and stored in an air-conditioned room.
Extraction and isolation – Dried whole plants of A. yokoscense (500.0 g) were extracted with 80% methanol (2 L, 3 h × 5) by ultrasonication at room temperature. The methanol extract was concentrated in vacuo to give a crude extract (17.2 g). This extract was suspended in H2O and partitioned successively with n-hexane, CH2Cl2, EtOAc and H2O, giving a solid residue of 2.0 g, 2.5 g, 0.8 g and 10.8 g, respectively.
The hexane fraction was subjected to MPLC on a C-18 column (Reveleris® C18 column, 80 g) using a gradient binary solvent system of H2O – acetonitrile (10% to 90% MeCN, 25 mL/min) and yielded four fractions (H1-H4). Compound 3 was purified with semi-preparative HPLC on a C-18 column (YMC J’Sphere C18 column, 250 × 10 mm) with an isocratic solvent condition (40% MeCN in H2O, 3 mL/min) from H1. The CH2Cl2 fraction was subjected to MPLC on a C-18 column (Reveleris® C18 column, 80 g) using a gradient binary solvent system of H2O – acetonitrile (10% to 90% MeCN, 25 mL/min) and yielded five fractions (M1-M5). Compounds 1, 2 and 4 were isolated with semi-preparative HPLC on a C-18 column (YMC J’Sphere C18 column, 250 × 10 mm) with an isocratic solvent system (50% MeCN in H2O, 3 mL/min) from M1. The MPLC was performed on a Reveleris® 100922T MPLC system with Reveleris® C18 columns. The semi-preparative HPLC was equipped with a Gilson 321 solvent pump and a Gilson 151 UV-Visible detector (254 nm).
Identification – Isolated compounds from A. yokoscense were identified by NMR and mass spectrometry. 1H and 13C NMR spectra were measured on a JEOL GSX 400 spectrometer (1H at 400 MHz and 13C at 100 MHz) in methanol-d4 for compounds 1, 2, and 4 and in chloroform-d for compound 3. UPLC-QTOF/MS data were acquired from the Waters Acquity UPLC system with negative electrospray.
Aspidinol B (1) – Yellowish amorphous solid; 1H-NMR (methanol-d4, 400 MHz): δH 6.00 (1H, s, H-5), 3.80 (3H, s, H-8), 3.03 (2H, t, J = 7.32 Hz, H-2′), 1.90 (3H, s, H-7), 1.68 (2H, m, H-3′), 0.97 (3H, t, J = 7.56 Hz, H-4′); 13C-NMR (methanol-d4, 100 MHz): δC 208.6 (C-1′), 165.8 (C-4), 164.5 (C-6), 162.7 (C-2), 106.5 (C-5), 105.4 (C-3), 91.7 (C-1), 56.4 (C-8), 47.8 (C-2′), 20.2 (C-3′), 15.1 (C-4′), 8.0 (C-7).
Aspidinol P (2) – Yellowish amorphous solid; 1H-NMR (methanol-d4, 400 MHz): δH 5.99 (1H, s, H-5), 3.79 (3H, s, H-8), 3.07 (2H, q, J = 7.38 Hz, H-2′), 1.89 (3H, s, H-7), 1.12 (3H, t, J = 7.27 Hz, H-3′); 13C-NMR (methanol-d4, 100 MHz): δC 207.0 (C-1′), 163.5 (C-4), 162.3 (C-6), 160.6 (C-2), 104.2 (C-5), 103.2 (C-3), 89.5 (C-1), 55.8 (C-8), 36.9 (C-2′), 15.1 (C-3′), 8.0 (C-7).
Methylene-bis-aspidinol B (3) – Yellowish amorphous solid; 1H-NMR (chloroform-d, 400 MHz): δH 3.99 (6H, s, H-8, 8′), 3.68 (2H, s, H-7), 3.11 (4H, t, H-2″, 2‴), 2.13 (6H, s, H-9, 9′), 1.7 (4H, m, H-3″, 3‴), 0.97 (6H, t, J = 7.27 Hz, H-4″, 4‴); 13C-NMR (chloroform-d, 100 MHz): δC 207.9 (C-1″, 1‴), 162.8 (C-4, 4′), 159.4 (C-6, 6′), 156.8 (C-2, 2′), 110.0 (C-5, 5′), 108.3 (C-3, 3′), 91.0 (C-1, 1′), 62.0 (C-8, 8′), 46.7 (C-2″, 2‴), 17.8 (C-7), 13.9 (C-4″, 4‴), 8.9 (C-9, 9′). The coupling constant for the δH 3.11 triplet is not reported.
Angophorol (4) – White powder; 1H-NMR (methanol-d4, 400 MHz): δH 7.41 (2H, d, J = 8.72 Hz, H-2′, 6′), 6.95 (2H, d, J = 8.72 Hz, H-3′, 5′), 5.34 (1H, dd, J = 12.5, 3.15 Hz, H-2), 3.80 (3H, s, 7-OMe), 3.05 (1H, dd, J = 4.5, 16.9 Hz, Ha-3), 2.74 (1H, dd, J = 2.7, 17 Hz, Hb-3), 1.99 (3H, s, 6-Me), 1.98 (3H, s, 8-Me); 13C-NMR (methanol-d4, 100 MHz): δC 199.1 (C-4), 164.9 (C-7), 162.0 (C-5), 161.0 (C-4′), 160.0 (C-9), 133.5 (C-1′), 129.5 (C-2′, 6′), 115.8 (C-3′, 5′), 105.6 (C-10), 104.9 (C-8), 104.0 (C-6), 80.6 (C-2), 56.5 (7-OMe), 44.8 (C-3), 8.9 (6-Me), 8.1 (8-Me). Specific rotation ([α]D) is not reported for this isolate, and the absolute configuration at C-2 is not assigned.
Cell culture – BV2 microglial cells originally developed by Dr. Bocchini at University of Perugia (Perugia, Italy) were generously provided by Dr. Sun-yeou Kim at Kyung Hee University (Yongin, Korea). The cells were maintained in Dulbecco’s modified Eagle’s medium (DMEM, Gibco) containing 10% fetal bovine serum (FBS, Gibco) with penicillin (100 units/mL) and streptomycin (100 μg/mL) at 37°C in a humidified atmosphere of 95% air with 5% CO2.
Cell viability assay – Cell viability was assessed in BV2 cells treated with compounds 1 and 2 at 10, 50, and 100 μM using the MTT assay. After incubation in 96-well plates for 24 h, the medium was replaced with fresh medium containing MTT (0.2 mg/mL), and the cells were incubated for a further 3 h at 37°C. The supernatant was then removed, and 100 μL of DMSO was added to dissolve the formazan crystals. The absorbance at 540 nm was measured using a microplate reader. Cell viability was expressed as a percentage of the control group.
Measurement of nitrite accumulation – The test compounds were dissolved in dimethyl sulfoxide (DMSO, Sigma-Aldrich), and the final DMSO concentration in the culture medium did not exceed 0.1%. BV2 cells were seeded in 96-well plates at a density of 4 × 10⁴ cells/well. The cells were pretreated with the test samples for 1 h and then stimulated with LPS (500 ng/mL, Sigma-Aldrich). After a further 24 h, nitrite in the culture medium was measured with the Griess assay as an indirect index of NO production. The NOS inhibitor L-NAME (Nω-nitro-L-arginine methyl ester, 50 μM) was included as a positive control. The unstimulated control received no LPS, and the LPS control received LPS without a test compound.
Western blotting analysis – BV2 cells were seeded in 6-well plates at a density of 8 × 10⁵ cells in 2 mL of DMEM per well and stimulated with LPS (500 ng/mL) in the presence of the test samples. Primary antibodies against iNOS (Thermo Fisher Scientific), COX-2 and β-Actin (Santa Cruz Biotechnology), and ERK, p-ERK, JNK, p-JNK, p38, and p-p38 (Cell Signaling Technology) were diluted in TBST containing 2% skim milk according to the manufacturers' instructions. The membranes were incubated with the primary antibodies at 4°C overnight. The immunoreactive bands were detected with secondary antibodies conjugated to horseradish peroxidase and the ECL detection kit (Thermo Fisher Scientific).
Statistical analysis – Nitrite assay data are presented as the mean ± SEM of three technical replicates per condition from a single experiment. Comparisons with the LPS-treated control were performed using a t-test, with p < 0.05 considered statistically significant. The IC50 values for inhibition of LPS-induced nitrite accumulation were calculated using GraphPad Prism version 5.00 for Windows (GraphPad Software, San Diego, CA, USA). MTT results are expressed as cell viability relative to the control. Western blot quantification represents normalized band intensities from a single experiment and is presented descriptively without error bars or statistical comparisons.
Results and Discussion
Three phloroglucinol derivatives and one flavonoid were isolated from the methanolic extract of A. yokoscense. Their structures were identified as aspidinol B (1), aspidinol P (2), methylene-bis-aspidinol B (3), and angophorol (4) by comparison of the spectroscopic data with reported values (Fig. 1).20,21 To our knowledge, this is the first report of these four compounds from A. yokoscense.
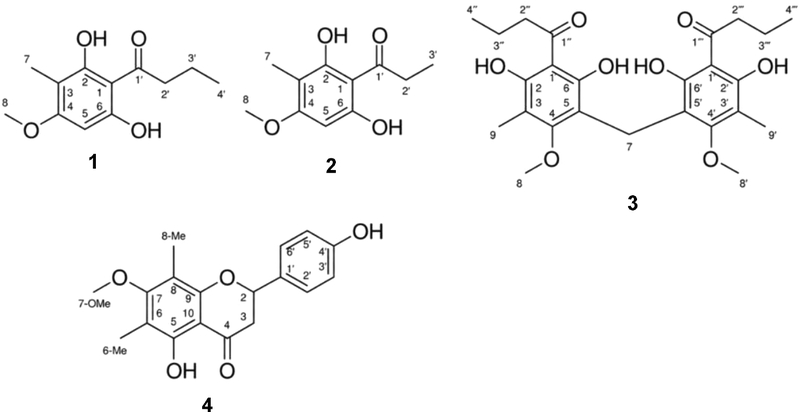
Chemical structures of compounds isolated from A. yokoscense. Aspidinol B (1), aspidinol P (2), methylene-bis-aspidinol B (3), and angophorol (4).
The isolated compounds were evaluated for their effects on LPS-induced nitrite accumulation in BV2 microglial cells. The Griess reaction measures extracellular nitrite, which was used as an indirect index of NO production. Nitrite accumulation generally decreased as the concentrations of compounds 1–4 increased (Fig. 2A). The IC50 values for compounds 1, 2, and 3 were 34.8, 55.4, and 70.0 μM, respectively. Compound 4 did not reach 50% inhibition at 100 μM, and its IC50 was therefore >100 μM. The positive control L-NAME (50 μM) also reduced LPS-induced nitrite accumulation. These results show lower IC50 values for compounds 1 and 2 than for compounds 3 and 4. In the MTT assay, cell viability was 98.5–103.0% for compound 1 and 97.0–99.6% for compound 2 at 10–100 μM (Fig. 2B), indicating no marked reduction in the MTT viability readout over this concentration range.
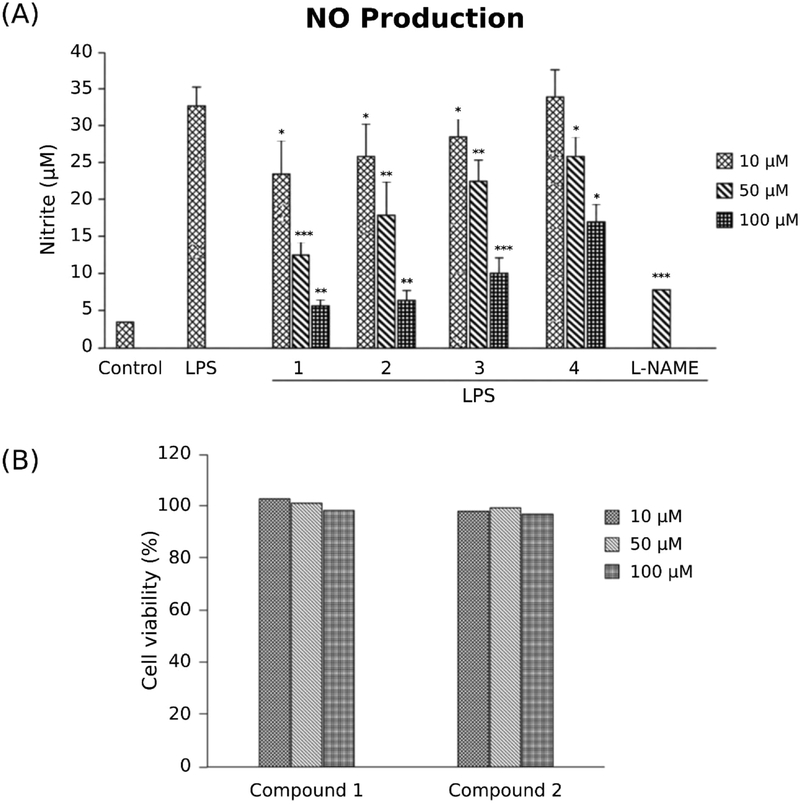
lated from A. yokoscense on nitrite accumulation and cell viability in BV2 cells. (A) Extracellular nitrite accumulation after treatment with compounds 1–4 at 10, 50, and 100 µM in the presence of LPS (500 ng/mL). Cells were pretreated with the compounds for 1 h before LPS stimulation for 24 h. L-NAME (50 µM) was used as a positive control. Control denotes the unstimulated group, and LPS denotes the stimulated group without a test compound. Nitrite data are presented as the mean ± SEM of three technical replicates per condition from a single experiment. *p < 0.05, **p < 0.01, and ***p < 0.001 versus the LPS-treated control, determined using a t-test. (B) MTT cell viability after treatment with compounds 1 and 2 at 10, 50, and 100 µM, expressed as a percentage of the control.
To investigate the responses associated with nitrite inhibition, we examined iNOS and COX-2 protein abundance by immunoblot analysis. LPS treatment increased both proteins compared with the unstimulated vehicle control (Fig. 3). After normalization to β-actin, compound 1 reduced iNOS abundance at 50 and 100 μM, with ratios of 0.73 and 0.36 relative to the LPS control, respectively. COX-2 abundance was lower at 100 μM, with a ratio of 0.39. Compound 2 reduced COX-2 abundance at 50 and 100 μM, with ratios of 0.71 and 0.62, respectively, without reducing iNOS abundance. These observations associate the nitrite response to compound 1 with reduced iNOS abundance. The response to compound 2 could involve altered iNOS catalytic function, as inhibition of iNOS dimerization can suppress NO production.22 Matrix effects can also influence Griess measurements.23 Direct effects on iNOS function and compound-specific interference with nitrite recovery remain untested for compound 2. Reduced COX-2 abundance alone does not explain its effect on nitrite accumulation.
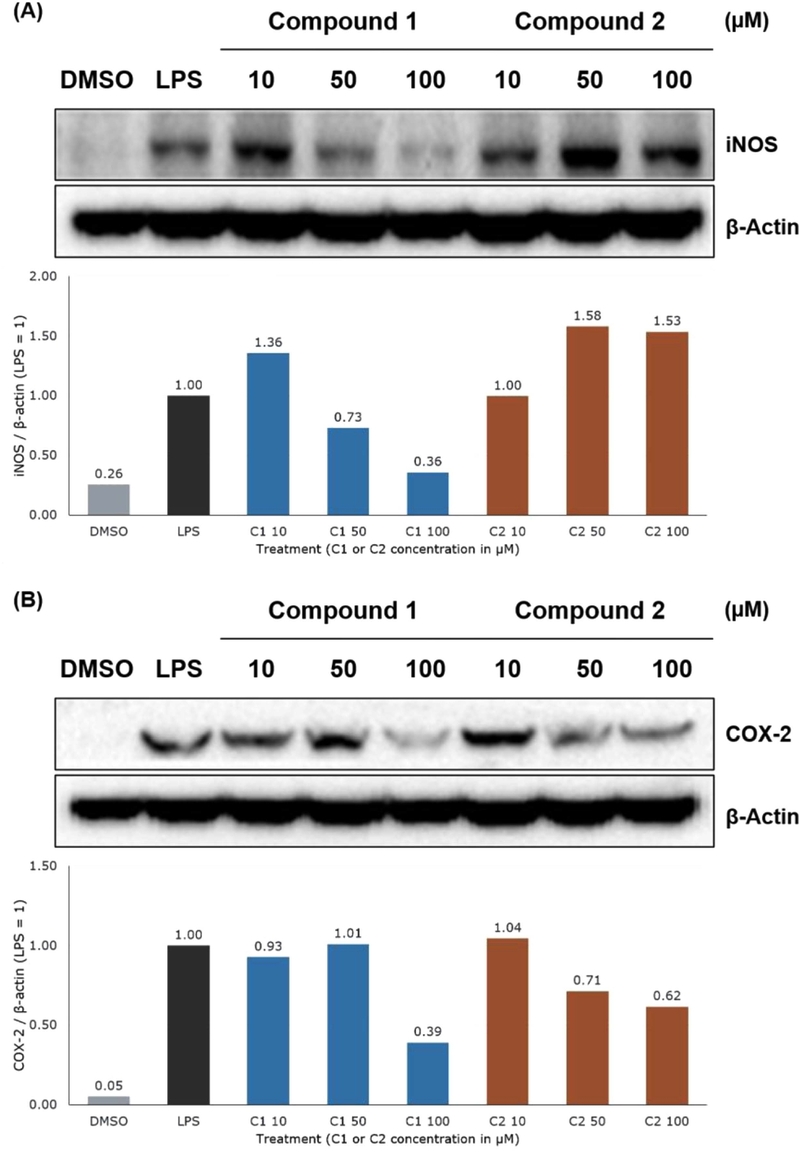
Effects of compounds 1 and 2 on iNOS (A) and COX-2 (B) protein abundance in lipopolysaccharide-stimulated BV2 cells. β-Actin was used as the loading control for each panel. iNOS and COX-2 were normalized to β-actin in the corresponding lane of their respective panels and then expressed relative to the LPS control (LPS = 1). DMSO and LPS denote the unstimulated vehicle control and the stimulated control without a test compound, respectively. Compounds 1 and 2 were tested at 10, 50, and 100 µM. C1 and C2 denote compounds 1 and 2, respectively.
Compounds 1 and 2 share an acylphloroglucinol scaffold and differ by one methylene unit in the acyl side chain, with butanoyl and propanoyl groups, respectively. Compound 3 contains two related units joined by a methylene bridge. Their IC₅₀ values from the iNOS assay suggest that the longer acyl side chain of compound 1 and the dimeric structure of compound 3 warrant further structure–activity relationship studies. These structural differences could affect solubility, cellular exposure, and molecular interactions, although these properties were not measured.
The expression of iNOS and COX-2 is regulated by several intracellular signaling pathways, including the MAPK pathways. ERK, JNK, and p38 MAPKs contribute to inflammatory gene expression in activated microglia.8 We therefore examined whether compound 1, which reduced both iNOS and COX-2 expression, affected LPS-induced MAPK phosphorylation. As shown in Fig. 4, compound 1 reduced the LPS-induced phosphorylation of ERK and JNK in a concentration-dependent manner, whereas p38 phosphorylation was not substantially affected. These results suggest that reduced ERK and JNK signaling contributes to the inhibitory effects of compound 1 on iNOS and COX-2 expression (Fig. 5). However, these findings do not establish ERK or JNK as direct molecular targets of compound 1.
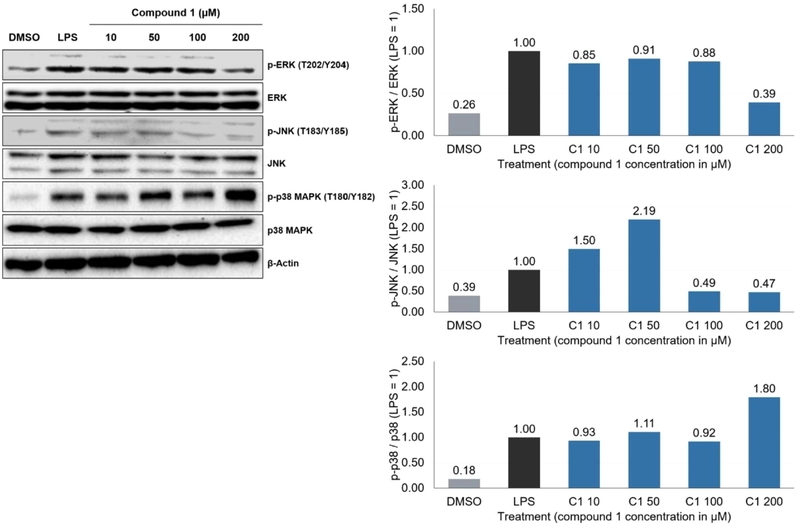
Effect of compound 1 on ERK, JNK, and p38 phosphorylation in lipopolysaccharide-stimulated BV2 cells. Phosphorylated ERK, JNK, and p38 were normalized to the corresponding total proteins in the same lane and then expressed relative to the LPS control (LPS = 1). DMSO and LPS denote the unstimulated vehicle and stimulated controls, respectively. Compound 1 was tested at 10, 50, 100, and 200 µM. C1 denotes compound 1.
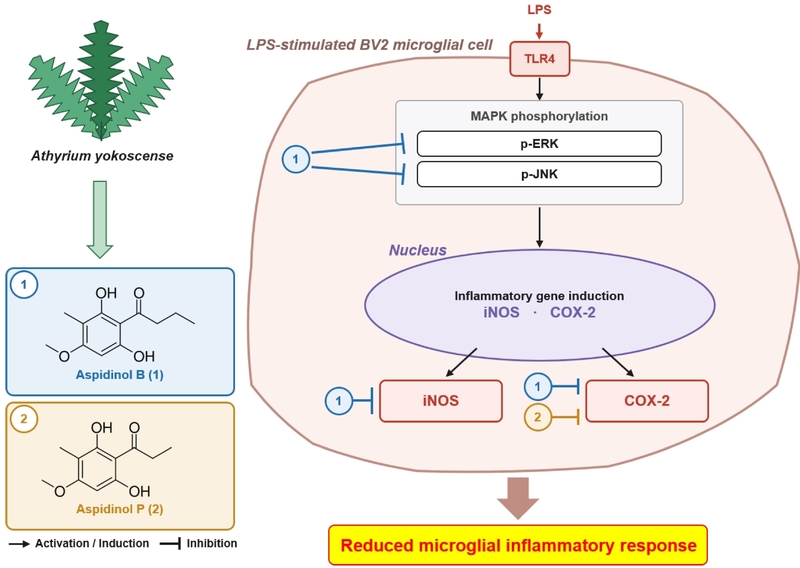
Schematic representation of the proposed mechanism of action of compounds 1 and 2 in BV2 cells. and in vivo models of neuroinflammation.
In conclusion, three phloroglucinol derivatives and one flavonoid were isolated for the first time from A. yokoscense and evaluated in LPS-stimulated BV2 microglial cells. Among the isolated compounds, aspidinol B (1) and aspidinol P (2) produced the greatest reductions in extracellular nitrite accumulation. Aspidinol B (1) also reduced iNOS and COX-2 protein expression and attenuated ERK and JNK phosphorylation, whereas aspidinol P (2) primarily reduced COX-2 expression under the conditions examined. These findings suggest that aspidinol B and aspidinol P contribute to the anti-inflammatory effects of the A. yokoscense extract and warrant further investigation using primary microglia, human-derived microglial models, and in vivo models of neuroinflammation.
Acknowledgments
This article is dedicated to Professor Sang Kook Lee on the occasion of his retirement, in recognition of his outstanding and lasting contributions to natural product-based drug discovery. This work was supported by the National Research Foundation of Korea (NRF) grants funded by the Korea government (MSIT) (RS-2023-00211868, RS-2026-25469433, and RS-2026-25506638). The authors thank N. Cho, J. Huh, S. Woo, and S. H. Sung for helpful discussions.
Conflicts of Interest
The authors declare that they have no conflicts of interest.
References
-
Qin, J.; Ma, Z.; Chen, X.; Shu, S. Front. Neurol. 2023, 14, 1103416.
[https://doi.org/10.3389/fneur.2023.1103416]

-
Zong, S.; Cui, X.; Wu, S.; Lu, Z. Cell. Mol. Immunol. 2026, 23, 787–805.
[https://doi.org/10.1038/s41423-026-01438-3]
-
Perry, V. H.; Gordon, S. Trends Neurosci. 1988, 11, 273–277.
[https://doi.org/10.1016/0166-2236(88)90110-5]
-
Kettenmann, H.; Hanisch, U.-K.; Noda, M.; Verkhratsky, A. Physiol. Rev. 2011, 91, 461–553.
[https://doi.org/10.1152/physrev.00011.2010]
-
Qin, L.; Liu, Y.; Wang, T.; Wei, S. J.; Block, M. L.; Wilson, B.; Liu, B.; Hong, J.-S. J. Biol. Chem. 2004, 279, 1415–1421.
[https://doi.org/10.1074/jbc.M307657200]
-
Gao, H.-M.; Jiang, J.; Wilson, B.; Zhang, W.; Hong, J.-S.; Liu, B. J. Neurochem. 2002, 81, 1285–1297.
[https://doi.org/10.1046/j.1471-4159.2002.00928.x]
-
Zhang, N.; Xiong, N.; He, Y.; Zhou, L. Brain Res. Bull. 2026, 239, 111887.
[https://doi.org/10.1016/j.brainresbull.2026.111887]
-
Lehnardt, S.; Massillon, L.; Follett, P.; Jensen, F. E.; Ratan, R.; Rosenberg, P. A.; Volpe, J. J.; Vartanian, T. Proc. Natl. Acad. Sci. U. S. A. 2003, 100, 8514–8519.
[https://doi.org/10.1073/pnas.1432609100]
-
Guijarro-Muñoz, I.; Compte, M.; Álvarez-Cienfuegos, A.; Álvarez-Vallina, L.; Sanz, L. J. Biol. Chem. 2014, 289, 2457–2468.
[https://doi.org/10.1074/jbc.M113.521161]
-
Park, H. Y.; Han, M. H.; Park, C.; Jin, C.-Y.; Kim, G.-Y.; Choi, I.- W.; Kim, N. D.; Nam, T.-J.; Kwon, T. K.; Choi, Y. H. Food Chem. Toxicol. 2011, 49, 1745–1752.
[https://doi.org/10.1016/j.fct.2011.04.020]
-
Sharma, J. N.; Al-Omran, A.; Parvathy, S. S. Inflammopharmacology 2007, 15, 252–259.
[https://doi.org/10.1007/s10787-007-0013-x]
-
Kim, M. E.; Lee, J. S. Int. J. Mol. Sci. 2025, 26, 1204.
[https://doi.org/10.1007/s42405-025-00888-9]
-
Ito, H.; Muranaka, T.; Mori, K.; Jin, Z.-X.; Tokuda, H.; Nishino, H.; Yoshida, T. Chem. Pharm. Bull. 2000, 48, 1190–1195.
[https://doi.org/10.1248/cpb.48.1190]
-
Lai, H.-Y.; Lim, Y.-Y.; Tan, S.-P. Biosci. Biotechnol. Biochem. 2009, 73, 1362–1366.
[https://doi.org/10.1271/bbb.90018]
-
Cao, J.-G.; Xia, X.; Chen, X.-F.; Xiao, J.; Wang, Q.-X. Food Chem. Toxicol. 2013, 51, 242–250.
[https://doi.org/10.1016/j.fct.2012.09.039]
-
PPG I. J. Syst. Evol. 2016, 54, 563–603.
[https://doi.org/10.1111/jse.12229]
-
Ohta, S.; Guo, J.-R.; Hiraga, Y.; Suga, T. Phytochemistry 1996, 41, 745–747.
[https://doi.org/10.1016/0031-9422(95)00688-5]
-
Hiraga, Y.; Kurokawa, M.; Guo, J.-R.; Suga, T. Biosci. Biotechnol. Biochem. 1999, 63, 958–960.
[https://doi.org/10.1271/bbb.63.958]
-
Lee, J.-K.; Choi, W. S.; Song, J. Y.; Kwon, O. S.; Lee, Y. J.; Lee, J. S.; Lee, S.; Choi, S. R.; Lee, C. H.; Lee, J.-Y. Toxicol. Res. 2023, 39, 135–146.
[https://doi.org/10.1007/s43188-022-00154-0]
-
Zhao, D.-D.; Zhao, Q.-S.; Liu, L.; Chen, Z.-Q.; Zeng, W.-M.; Lei, H.; Zhang, Y.-L. Molecules 2014, 19, 3345–3355.
[https://doi.org/10.3390/molecules19033345]
-
Yoshimura, M.; Ito, H.; Miyashita, K.; Hatano, T.; Taniguchi, S.; Amakura, Y.; Yoshida, T. Phytochemistry 2008, 69, 3062–3069.
[https://doi.org/10.1016/j.phytochem.2008.04.004]
-
McMillan, K.; Adler, M.; Auld, D. S.; Baldwin, J. J.; Blasko, E.; Browne, L. J.; Chelsky, D.; Davey, D.; Dolle, R. E.; Eagen, K. A.; Erickson, S.; Feldman, R. I.; Glaser, C. B.; Mallari, C.; Morrissey, M. M.; Ohlmeyer, M. H. J.; Pan, G.; Parkinson, J. F.; Phillips, G. B.; Polokoff, M. A.; Sigal, N. H.; Vergona, R.; Whitlow, M.; Young, T. A.; Devlin, J. J. Proc. Natl. Acad. Sci. U. S. A. 2000, 97, 1506–1511.
[https://doi.org/10.1073/pnas.97.4.1506]
-
Hunter, R. A.; Storm, W. L.; Coneski, P. N.; Schoenfisch, M. H. Anal. Chem. 2013, 85, 1957–1963.
[https://doi.org/10.1021/ac303787p]