
Anti-inflammatory Effects of Fermented Products with Brassica rapa subsp. pekinensis Regulating Inflammation
Abstract
This research assessed the anti-inflammatory effectiveness of fermented products of Brassica rapa subsp. pekinensis utilizing a murine model of dextran sulfate sodium (DSS)-induced colitis. Oral administration of fermented products significantly reduced the disease activity index (DAI) and improved characteristic symptoms of colitis, such as colon shortening and mucosal thickening. Histological analysis demonstrated that these product treatments preserved mucosal integrity, maintaining crypt architecture and mucosa length similar to the control group, without negatively impacting body weight. Their extracts inhibited production of pro-inflammatory cytokines (IL-6, IL-1β) and inflammatory markers including myeloperoxidase (MPO), while maintaining the levels of the regulatory anti-inflammatory cytokine IL-10. Among them, the 4-week fermented product exhibited significant protective effects against intestinal inflammation. Additionally, feature-based molecular networking revealed a major component of coumarin derivatives in the extract, which demonstrated robust predicted interactions with critical inflammatory protein targets. Our findings highlight the therapeutic potential of fermented products, especially varieties fortified with green tea, as a functional dietary intervention for the management and prevention of inflammatory bowel disease.
Keywords:
Brassica rapa subsp. pekinensis, Inflammatory bowel disease, Inflammatory cytokines, Mice, Histopathological analysisIntroduction
Inflammatory bowel disease (IBD) has spread around the world in the 21st century. This trend is no longer limited to the West; it is being driven by the Westernization of lifestyles around the world, where high-fat diets, chronic stress, and environmental pollutants all work together to upset gut homeostasis.1 This imbalance triggers a breakdown of the intestinal barrier, releasing a cytokine storm of IL-6, IL-1β, and other cytokines that drives a persistent inflammatory cascade.2 This dysregulation induces the overproduction of reactive oxygen species (ROS), nitric oxide (NO), and other oxidative metabolites, which can exert cytotoxic effects on the mucosal barrier.3,4 To heal the compromised intestinal barrier, botanical extracts and phytochemicals with favorable safety profiles have been developed as key agents in modulating the inflammatory response and re-establishing intestinal equilibrium.5 Within this context of searching for safer therapeutic agents, traditional fermented foods serve as a potent treatment strategy. In the traditional Korean meal, kimchi represents a complex fermented matrix where napa cabbage, radish, and spices act as a biological factory for the proliferation of lactic acid bacteria (LAB).6 This activity catalyzes the biotransformation of raw ingredients into various bioactive metabolites, including organic acids, γ-aminobutyric acid (GABA), and short-chain fatty acids (SCFAs).6,7 In terms of bioactivity, these metabolites play a crucial role in maintaining intestinal barrier integrity and inhibiting pro-inflammatory cytokine expression. To optimize these protective effects, low-salt and green tea fermented products have emerged as a promising functional intervention. While low-salt conditions ensure microbial stability and LAB growth, the addition of green tea introduces polyphenols like EGCG. These polyphenols interact synergistically with the fermentation products to exert superior anti-inflammatory and antioxidant effects, further safeguarding gut health.8,9
Building upon this biological rationale, the present study systematically compared low-salt (LK) and green tea (GK) fermented products over two periods (4 and 8 weeks) to identify the optimal formulation for intestinal protection. To validate the therapeutic potential discussed earlier, an in vivo screening using a DSS-induced colitis model was conducted. Evaluation via body weight, disease activity index (DAI), colon length, colon weight, histopathology, mucosa length, cytokine levels (IL-6, IL-1β, and IL-10), and myeloperoxidase (MPO) activity consistently pinpointed GK4 as the most efficacious candidate. To elucidate the chemical basis of this extract solution, we performed advanced profiling via UHPLC-Orbitrap-MS, integrated with MS-DIAL for peak alignment and GNPS2 for molecular networking. This integrated metabolomic approach identified several major metabolites that may contribute to the anti-inflammatory effects of the extract. Their potential involvement was further explored by molecular docking simulations, which demonstrated favorable interactions with inflammation-related protein targets.
Experimental
Plant materials – Fermented products of B. rapa subsp. pekinensis were abbreviated as 4-week fermented low-salt (LK4), 4-week fermented green tea (GK4), 8-week fermented low-salt (LK8), and 8-week fermented green tea (GK8), respectively, as shown in Table 1.

List of abbreviations used in the paper.
Animals – Male BALB/c mice (6-week-old) were purchased from Hanabio Co., Ltd. (Seongnam, Gyeonggi-do, Republic of Korea). Mice were quarantined and acclimatized for one week at the animal facility of the Dongnam Medical Chemical Research Institute (Registration No. 412). The mice were housed under a controlled 12-hour light/dark cycle with ad libitum access to a standard pellet diet (Samtako Bio Korea Co., Ltd., Osan, Gyeonggi-do, Republic of Korea) and water. Detailed information was summarized in Table 2. Body weight, as well as food and water intake, were monitored twice weekly throughout the study. All experimental procedures were approved by the Institutional Animal Care and Use Committee (IACUC) of the Dongnam Institute of Chemical Research (Approval No. SEMI-20-012) and conducted in accordance with relevant ethical guidelines.
Experimental design of mice.
Experimental design and DSS-induced colitis model – Dextran sulfate sodium, a widely established colitogen, effectively replicates the pathological features of human ulcerative colitis by compromising the intestinal epithelial barrier.10 As a polyanionic derivative of dextran, DSS interacts directly with the colonic mucosa, triggering a systemic inflammatory response characterized by a cytokine storm and a triad of clinical markers: rapid weight loss, rectal bleeding, and colonic shortening.11 In this study, the DSS-induced model was employed to evaluate the potency of fermented products in restoring mucosal integrity and neutralizing inflammatory cascades.
All fermented products were dissolved in saline and administered orally at a dosage of 500 mg/kg (volume: 10 mL/kg) for 21 consecutive days. Except for the normal group (N), 2.5% (w/v) DSS was added to the drinking water of all experimental groups to induce acute colitis during 5 days of the experiment, as summarized in Table 2. At the end of the experiment, histological alterations were assessed via hematoxylin and eosin (H&E) staining to evaluate morphological changes and the potential effect of the samples. Colonic inflammatory cytokine levels and MPO activity were also quantified to determine the degree of the inflammatory response.
Assessment of disease activity index (DAI) – To evaluate the severity of DSS-induced colitis, the DAI was monitored daily throughout the 5-day DSS administration period until study termination. This index was calculated as a composite score derived from three primary symptomatic parameters: body weight reduction, stool consistency, and the presence of occult or gross blood, as detailed in Table 3.12 Each parameter was graded on a scale of 0 to 4, with the cumulative scores averaged to represent the overall inflammatory status. This scoring system facilitated a non-invasive, temporal evaluation of colonic injury progression and the protective efficacy of the fermented products during the acute phase of inflammation.
Disease activity index (DAI) score parameters.
Blood collection and tissue extraction – Following the 5-day DSS induction, mice were fasted for 16 h and sacrificed via CO2 inhalation. The colon, extending from the cecum to the anus, was harvested, and its weight and length were recorded. Subsequently, the colon was flushed with ice-cold saline to remove fecal contents. The rectal section was collected and fixed in 4% paraformaldehyde for histopathological examination. The remaining colonic tissue was homogenized in phosphate-buffered saline (PBS) at a ratio of 0.1 g/mL. After centrifugation, the supernatant was collected and stored at −70°C for subsequent cytokine quantification and myeloperoxidase activity measurement.
Measurement of inflammatory cytokines and myeloperoxidase activity – The concentrations of cytokines (IL-6, IL-10, and IL-1β) and MPO activity in colonic tissue homogenates were quantified using commercial enzyme-linked immunosorbent assay kits. Specifically, IL-6 (K0331230), IL-10 (K0331213), and IL-1β (K0331231) ELISA kits were sourced from Koma Biotech (Seoul, Republic of Korea), while the MPO ELISA kit (MBS176536) was obtained from MyBioSource (San Diego, CA, USA). All assays were performed in strict accordance with the manufacturer’s instructions. Absorbance was measured with a microplate reader, and final concentrations were calculated based on the standard curve provided with each kit.
Histopathological analysis – Colonic tissues fixed in 4% paraformaldehyde were embedded in paraffin and sectioned at a thickness of 5 μm. Following deparaffinization in xylene and rehydration through a graded series of ethanol, the sections were stained with hematoxylin and eosin (H&E). The stained slides were then mounted and examined under a light microscope (E600, Nikon, Tokyo, Japan). Representative images were captured at 40× and 100× magnifications to assess histopathological changes.
Preparation of GK4 extracts – To prepare the sample for analysis, 30 mg of dried GK4 powder was mixed with 3 mL of 100% methanol. Ultrasound-assisted extraction was performed at 40°C for 30 min to facilitate the release of phytochemical constituents. The resulting mixture was concentrated under vacuum using an Evatros T.C.S™ vacuum concentrator (Goojung Engineering, Seoul, Republic of Korea). The final concentrated extracts were stored at 4°C for further analysis.
LC-MS/MS conditions – The chemical profile of the GK4 extract was characterized using a Vanquish UHPLC system integrated with an Orbitrap Exploris 120 mass spectrometer (Thermo Fisher Scientific, Sunnyvale, CA, USA). Before injection, sample solutions were filtered through a 0.22 μm PTFE membrane (Agilent Technologies, Santa Clara, CA, USA). Chromatographic separation was achieved on an Acquity Premier HSS T3 column (4.6 × 100 mm, 1.8 μm; Waters, Milford, MA, USA) maintained at 40°C. The mobile phase consisted of 0.1% formic acid in both water (A) and acetonitrile (B). At a flow rate of 0.2 mL/min, the 4 μL injection was eluted using the following gradient program: 5–15% B (0–4 min), 15–35% B (4–12 min), 35–45% B (12–17 min), and 100% B at 23 min. The 100% B concentration was held for 3 min to wash the column, then returned to 5% B within 1 min and re-equilibrated for the next injection.
Molecular networking and structural annotation – The raw LC-MS/MS data were processed using MZmine 3.9.0 to generate high-quality peak lists. Initially, raw files were converted into mzXML format using the MSConvert tool from the ProteoWizard suite. These files were uploaded to the Global Natural Products Social Molecular Networking 2 (GNPS2) platform (https://gnps2.org/, Job ID: 1db91d6e5e104661bf74740246fada14, accessed on 15 January 2026) for metabolite analysis. In the molecular network, nodes represent molecules, while edges reflect structural similarity. Finally, the molecular networks were visualized and refined using Cytoscape 3.10.3 (https://cytoscape.org/, accessed on 15 January 2026) to provide a comprehensive overview of the metabolic profile of the fermented product. Structural annotation of the untargeted metabolite was performed by analyzing mass features based on the matching score between experimental and reference spectra, relying on precursor ion and isotope patterns.
Molecular docking analysis – Molecular docking simulations were performed to evaluate the binding affinity of compounds and target proteins against key cytokines, including IL-6 (PDB ID: 1ALU), IL-1β (PDB ID: 6Y8M), and IL-10 (PDB ID: 1J7V). The crystal structures were retrieved from the RCSB Protein Data Bank (https://www.rcsb.org/, accessed on 16 January 2026) and prepared using MGL Tools, which involved the removal of water molecules, addition of polar hydrogens, and assignment of Kollman charges. The 3D structures of the targeted candidates were obtained from PubChem (https://pubchem.ncbi.nlm.nih.gov/) and converted into pdbqt format via Open Babel, with optimized Gasteiger charges and flexible torsions. Molecular docking was conducted via the AutoDockTools-1.5.7 algorithm, where the grid box parameters were precisely centered to cover the functionally active sites. The coordinates for these docking grids were established based on previously validated binding sites and literature-reported coordinates for each protein. Specifically, the grids were centered on the known catalytic residues for IL-10, the established receptor-binding interface for IL-6, and the centroid of the co-crystallized ligand for IL-1β.13,14 Finally, the resulting binding orientations and intermolecular interactions were visualized and analyzed using Discovery Studio Visualizer 2025.
Statistical analysis – Statistical analyses were performed using StatView software. Differences were considered statistically significant at *p < 0.05, #p < 0.005, and †p < 0.0001 compared with the control group. Data were analyzed using Student’s t-test or one-way analysis of variance (ANOVA), as appropriate.
Results and Discussion
The successful establishment of the acute colitis model via 2.5% DSS administration was confirmed by a significant reduction in body weight gain and a concomitant elevation in disease activity index (DAI) scores. Body weight was monitored weekly throughout the experimental duration as an indicator of the mice’s health status and the clinical progression of colitis. At the beginning of the study, all groups exhibited comparable baseline weights (19–20 g), ensuring the absence of initial physiological bias between the experimental groups (Fig. 1). During the first two weeks, a consistent and steady weight gain was observed across all test groups, reaching nearly 23–24 g; this suggests that the oral administration of both low-salt and green tea fermented products at 500 mg/kg was well-tolerated and did not induce acute systemic toxicity. However, following the induction of colitis with 2.5% DSS in week 3, distinct growth profiles were observed across the experimental groups. While the normal group (N) achieved the highest mean weight (~25 g), the colitis control (C), the 4-week fermented groups (LK4, GK4), and the 8-week green tea group (GK8) showed limited body weight accrual, stabilizing at approximately 24 g. In particular, the LK8 cohort failed to exert protective effects, which suggests a lack of efficacy in preventing DSS-induced body mass reduction. The DAI score was assessed daily to evaluate the clinical severity of DSS-induced colitis, incorporating parameters such as stool consistency, gross bleeding, and weight loss (Table 3). Throughout the 5-day observation period, the N group maintained a baseline DAI score of 0.0 ± 0.0, indicating no clinical signs of intestinal distress. In contrast, the C group exhibited a rapid and progressive increase in DAI scores, peaking at 7.3 ± 0.8 by day 5, indicating severe clinical distress (Fig. 2). Notably, all fermented products demonstrated a significant attenuation of clinical symptoms compared to the C group. In the early stage of induction (day 2), the GK4 and GK8 groups were particularly effective in reducing the initiation of symptoms, maintaining lower scores (1.7 ± 1.3 and 1.7 ± 0.8, respectively; p < 0.005) than the control. By the intermediate stage (days 3–4), a significant reduction in DAI was observed across all treatment cohorts, with scores stabilizing between 2.6 and 3.1, while the colitis group reached nearly 4.0. Thus, the therapeutic effects of GK4 and GK8 appear localized to the early pathogenesis of colitis (days 2–3). However, on day 5, the sample group exhibited a significant increase in the severity of symptoms, with scores becoming comparable to those of the colitis control. Such a pattern is associated with the onset of the acute phase of inflammation, which can present clinically with symptoms such as diarrhea and bloody stools. It is proposed that the GK4 and GK8 samples have strong anti-inflammatory properties at early stages of the disease (days 2–3).
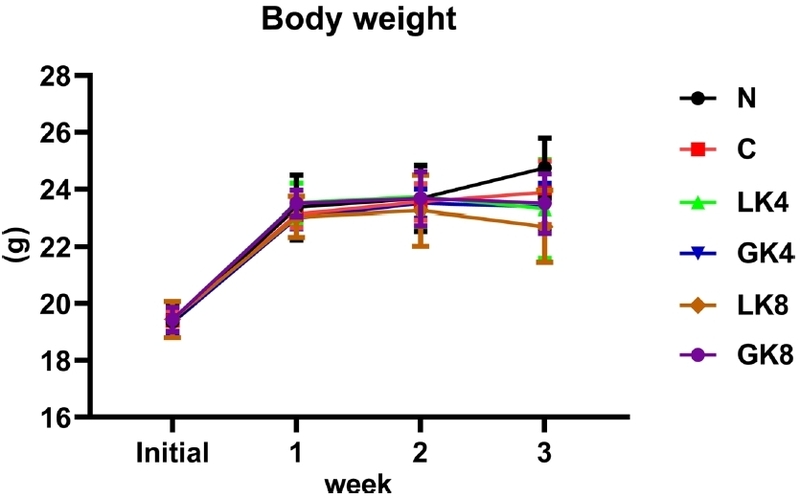
Changes in body weight over the 3-week study period. Mean body weight (g) ± SD is shown for the Normal (N), Control (C), LK4 (4-week-fermented low-salt B. rapa), GK4 (4-week-fermented green tea-fortified B. rapa), LK8 (8-week-fermented low-salt B. rapa), and GK8 (8-week-fermented green tea-fortified B. rapa) groups. Body weight of mice was altered in all groups over time, with slight variations among treatment groups during weeks 2–3. Seven independent experiments were performed for each group.
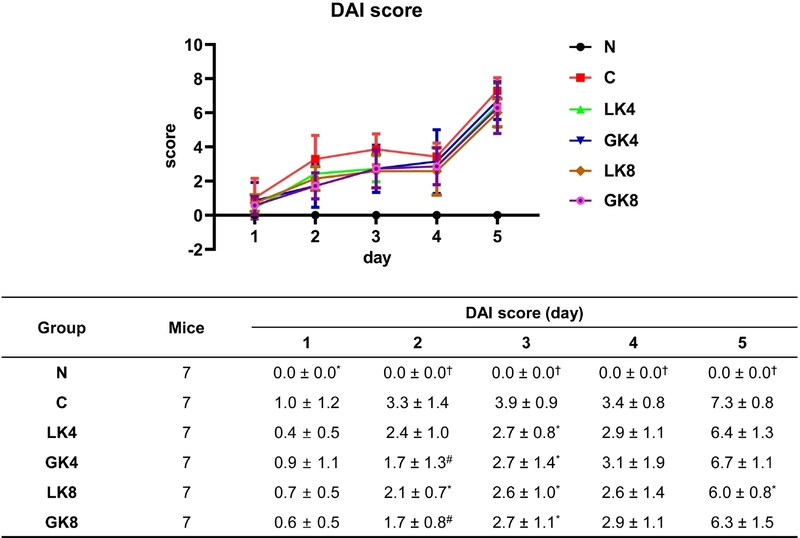
Effect of samples on DAI score in 2.5% DSS-induced colitic mice. *p < 0.05, #p < 0.005, †p < 0.0001 compared with the control group. These values are expressed as mean ± SD (n = 7 for each group). Normal (N), Control (C), LK4 (4-week-fermented low-salt B. rapa), GK4 (4-week-fermented green tea-fortified B. rapa), LK8 (8-week-fermented low-salt B. rapa), and GK8 (8-week-fermented green tea-fortified B. rapa) groups.
Morphological alterations were analyzed to quantify the protective impact of fermented products against DSS-induced damage. Since the degree of intestinal inflammation correlates strongly with colon contraction, both the length and weight of the colon were measured post-induction. These metrics allowed for a precise determination of the extent of tissue edema and mucosal recovery across the different treatment groups. Colon length was measured as a definitive morphological indicator of colitis severity, as significant shortening typically represents the extent of mucosal damage and intestinal inflammation. At the terminal of the experimental period, the healthy group exhibited the longest colons, averaging 10.7 ± 1.1 cm (Fig. 3). In contrast, the induction of colitis with 2.5% DSS caused severe structural atrophy in the untreated group, where colon length was dramatically reduced to 7.8 ± 0.6 cm (p < 0.0001 compared to the N group). Interestingly, these products attenuated the reduction in colon length to varying degrees, indicating a preserved intestinal structure against DSS-induced damage. Among all treated groups, GK8 demonstrated the most pronounced protective effect. This group maintained a colon length of 9.0 ± 0.8 cm, which was the only treatment to reach statistical significance (p < 0.05) compared to the colitis control group. Both the 4-week and 8-week fermented low-salt groups (LK4 and LK8) showed a consistent trend in preserving intestinal structure, with both groups reaching a mean length of 8.7 cm. The GK4 group showed a more moderate improvement in colon length compared to other treatment cohorts, averaging 8.2 ± 1.4 cm. While colon length showed significant alterations, colon weight remained relatively stable across the experimental groups. The normal group maintained an average colon weight of 0.176 ± 0.030 g (Fig. 4). The control group showed a minor reduction to 0.165 ± 0.037 g. This difference was not statistically significant, suggesting that the primary impact of 2.5% DSS in this study was morphological shortening rather than a significant alteration in the overall mass of the colonic tissue. The LK4 group exhibited the lowest colon weight among all cohorts at 0.140 ± 0.033 g. The remaining treatment groups, namely GK4 (0.167 ± 0.021 g), LK8 (0.153 ± 0.022 g), and GK8 (0.158 ± 0.023 g), maintained relatively stable weights that were comparable to the values recorded for the colitis control group.
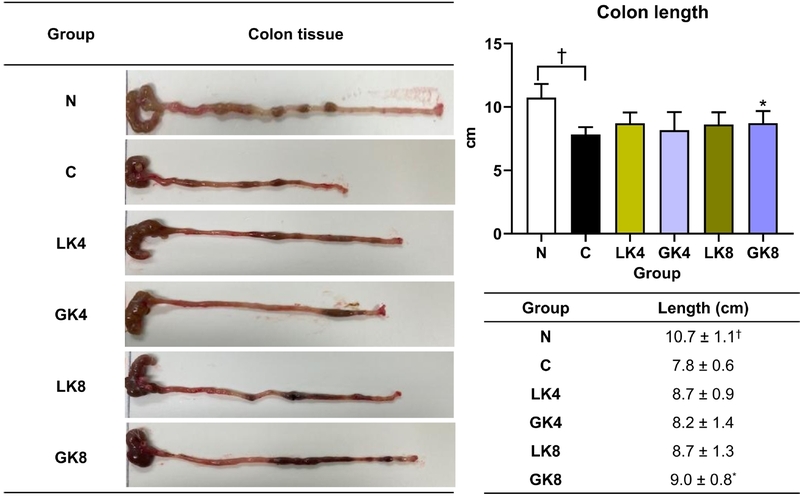
Effect of samples on colon length (cm) in 2.5% DSS-induced colitic mice. *p < 0.05, †p < 0.001 compared with the control group. These values were expressed as mean ± SD (n = 7 for each group). Normal (N), Control (C), LK4 (4-week-fermented low-salt B. rapa), GK4 (4-week-fermented green tea-fortified B. rapa), LK8 (8-week-fermented low-salt B. rapa), and GK8 (8-week-fermented green tea-fortified B. rapa) groups.
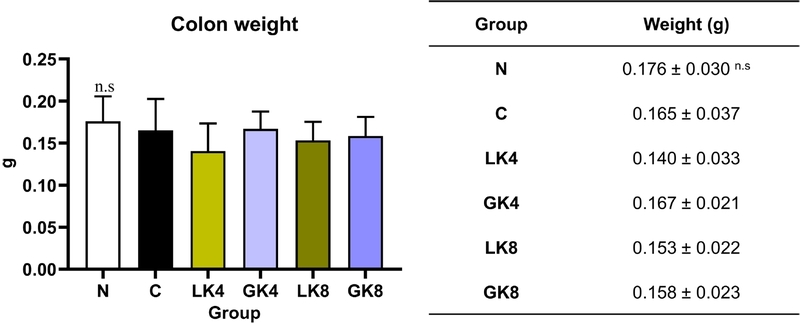
Effect of samples on colon weight (g) in 2.5% DSS-induced colitic mice. Values are presented as mean ± SD (n = 7 for each group). Normal (N), Control (C), LK4 (4-week-fermented low-salt B. rapa), GK4 (4-week-fermented green tea-fortified B. rapa), LK8 (8-week-fermented low-salt B. rapa), and GK8 (8-week-fermented green tea-fortified B. rapa) groups.
To further examine the histopathological changes, colonic structural integrity was assessed via H&E staining and subsequent measurement of mucosal thickness. This parameter is a vital marker for evaluating mucosal edema, a hallmark of acute intestinal injury in the DSS model.15 The untreated disease model showed severe pathological alterations, characterized by a complete collapse of the mucosal organization (Fig. 5). This included the total disappearance of crypt structures and a heavy influx of inflammatory cells that distorted the tissue layers (indicated by arrows). In contrast, the administration of fermented products effectively prevented this structural breakdown. The GK4 group demonstrated superior tissue recovery, maintaining the epithelial surface. In these sections, the crypts were neatly organized and deeply embedded, showing a density and morphology that nearly returned to the baseline seen in the normal group. Mucosa length serves as a critical histological parameter for evaluating intestinal health, as the mucosal layer typically undergoes abnormal thickening during acute colitis, a pathological response driven by edema and extensive inflammatory infiltration. Reflecting this phenomenon, mucosal thickness surged in the colitis control group; however, this elevation was effectively stabilized near baseline levels by sample administration. The healthy group exhibited a mucosal thickness of 74.37 ± 6.79 μm (Fig. 6). In the untreated control group, this value surged to 97.81 ± 6.72 μm, providing clear evidence of severe mucosal edema induced by DSS administration. The GK4 (71.68 ± 8.99 μm), GK8 (73.27 ± 15.31 μm), and LK4 (73.66 ± 17.67 μm) groups demonstrated the most pronounced protective efficacy. These cohorts maintained mucosal thickness levels nearly identical to the normal group, representing a significant reduction compared to the untreated group. The LK8 group recorded a mucosal thickness of 87.72 ± 1.21 μm. While this remained significantly lower than in the C group, LK8’s capacity to mitigate mucosal thickening was more moderate than that of the other fermented groups.
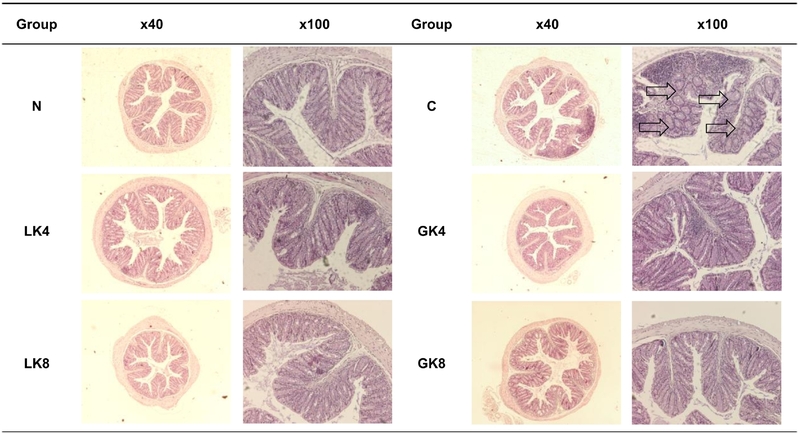
Histology of colon tissue in DSS-induced colitic mice. Normal (N), Control (C), LK4 (4-week-fermented low-salt B. rapa), GK4 (4-week-fermented green tea-fortified B. rapa), LK8 (8-week-fermented low-salt B. rapa), and GK8 (8-week-fermented green tea-fortified B. rapa) groups.
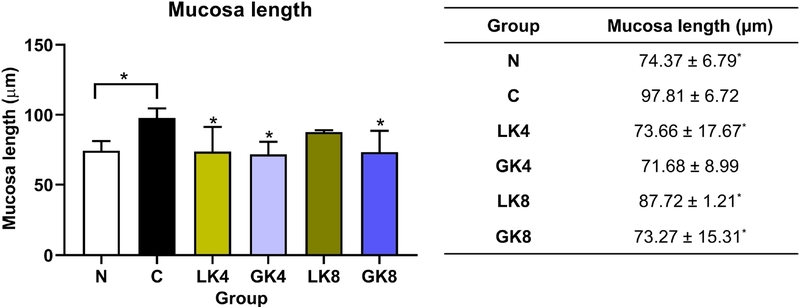
Effect of samples on mucosa length (µm) in 2.5% DSS-induced colitic mice. *p < 0.05 compared with the control group. Values are expressed as mean ± SD (n = 7 for each group). Normal (N), Control (C), LK4 (4-week-fermented low-salt B. rapa), GK4 (4-week-fermented green tea-fortified B. rapa), LK8 (8-week-fermented low-salt B. rapa), and GK8 (8-week-fermented green tea-fortified B. rapa) groups.
To elucidate the immunological mechanisms underlying the observed effect, the colonic expression levels of key cytokines and myeloperoxidase (MPO) activity were analyzed. We specifically examined the pro-inflammatory cytokines IL-6 and IL-1β, which act as central mediators of acute inflammatory responses, alongside the major regulatory cytokine IL-10, known for its potent inhibitory effects on inflammatory signaling.16,17 Furthermore, MPO activity was assessed as a marker of neutrophil infiltration, providing a comprehensive insight into how fermented product administration regulates the inflammatory cascade within the colonic tissue. The normal group showed IL-6 levels of 111.83 ± 11.68 pg/mL, which increased to 131.78 ± 16.95 pg/mL in the control group, reflecting the inflammatory response induced by DSS (Fig. 7A). All fermented products significantly reduced IL-6 expression compared to the control group. The GK4 group (80.49 ± 10.94 pg/mL) was particularly effective, normalizing these levels to values even lower than the healthy baseline. Moreover, the IL-1β experiment demonstrated the most dramatic fluctuation, as the control group underwent a profound elevation to 1615.00 ± 219.95 pg/mL – a sharp contrast to the N group (105.03 ± 17.85 pg/mL) (Fig. 7B). These products effectively suppressed this cytokine storm, with all experimental groups reducing IL-1β levels by over 75% (p < 0.0001). The GK4 (252.13 ± 33.59 pg/mL) and GK8 (327.54 ± 149.06 pg/mL) treatments proved to be the most effective at suppressing this inflammation. A compensatory increase in IL-10 levels was observed in the colitis control group (1217.20 ± 129.16 pg/mL) relative to the normal group (864.15 ± 86.64 pg/mL) (Fig. 7C). In the IL-10 assay, IL-10 concentrations were maintained within a stable range, fluctuating between 819.85 and 1086.05 pg/mL. This trend was particularly observed in the GK8 regulation, which exhibited the highest anti-inflammatory cytokine levels at 1086.05 ± 113.28 pg/mL among all treatment groups. Myeloperoxidase activity was assessed as a biochemical proxy for neutrophil infiltration within the colonic mucosa. Since MPO is an enzyme primarily localized in neutrophil granulocytes, its quantification serves as a reliable indicator of the acute inflammatory response and the extent of leukocyte recruitment following DSS exposure.18 In the C group, MPO activity doubled to 10001.6 ± 1058.7 pg/mL relative to the normal group (4802.2 ± 463.3 pg/mL), indicating severe leukocyte recruitment (Fig. 7D). Strikingly, all sample-treated groups (LK4, GK4, LK8, GK8) successfully restored MPO activity to levels virtually identical to the healthy group, with values ranging from 4729.2 to 5008.6 pg/mL.
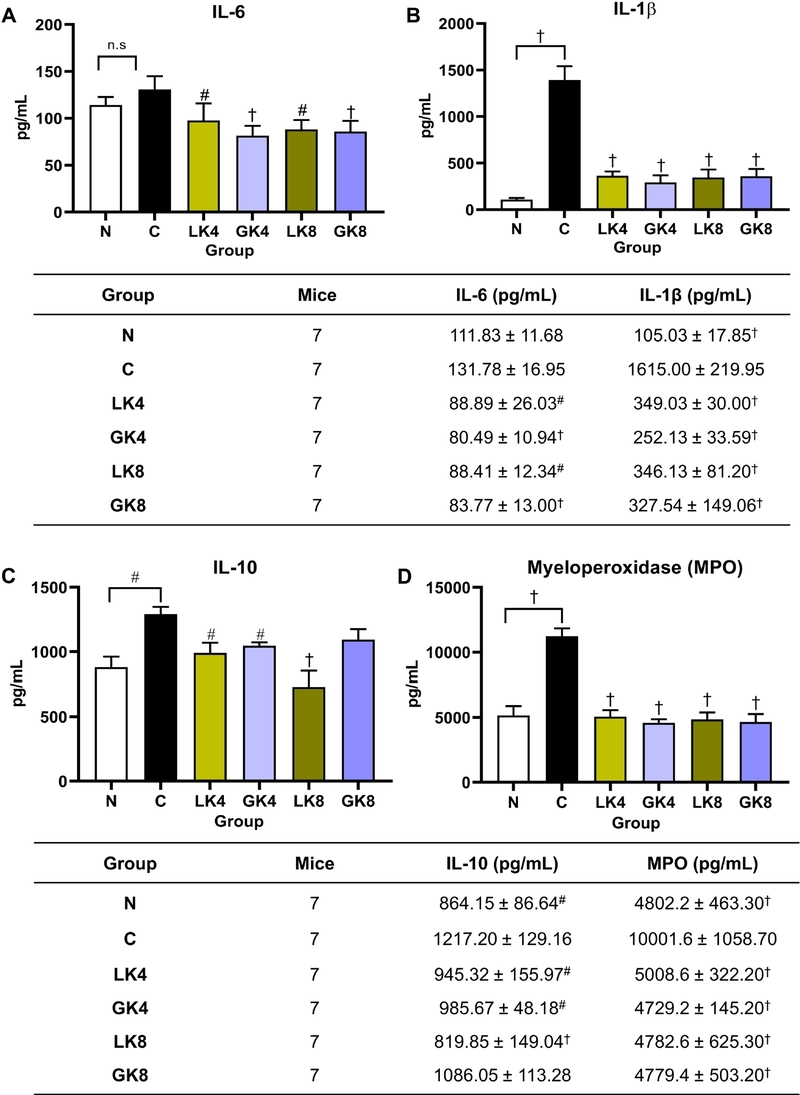
Inhibitory effect of samples on IL-6 (A), IL-1β (B), IL-10 (C), and MPO (D) activity (pg/mL) in 2.5% DSS-induced colitic mice. #p < 0.005, †p < 0.0001 compared with the control group. Values are presented as mean ± SD (n = 7 for each group). Normal (N), Control (C), LK4 (4-week-fermented low-salt B. rapa), GK4 (4-week-fermented green tea-fortified B. rapa), LK8 (8-week-fermented low-salt B. rapa), and GK8 (8-week-fermented green tea-fortified B. rapa) groups.
Altogether, the potent protective efficacy of the interventions is demonstrated by consistent recovery in clinical markers, including body weight, DAI, colon length, and weight-to-length ratio. This protective efficacy is definitively confirmed by the restoration of microscopic tissue integrity, which aligns precisely with the quantitative reduction in mucosal thickening observed in the histological analysis. From an immunological perspective, these improvements are further corroborated by the significant suppression of MPO activity and pro-inflammatory cytokines, with GK4 consistently emerging as the most effective group in restoring immunological balance.
Based on the potential anti-inflammatory effects of the GK4 sample, we investigated to characterize its unique chemical composition to identify the key bioactive constituent responsible for these effects. The identification of this bioactive constituent was facilitated by a systematic data processing and networking approach. Data processing was conducted using MZmine 3.9.0, where raw mass spectrometry files were subjected to a comprehensive workflow of feature detection, deconvolution, and annotation of metabolites. To visualize the structural connectivity of the metabolome, feature-based molecular networking (FBMN) was employed on the GNPS2 platform to organize the metabolites into structural clusters. The structural elucidation approach was significantly enhanced by the synergistic analysis of high-resolution mass data, accurate isotopic patterns, and MS/MS fragmentation pathways. These data were verified through spectral matching against extensive public databases and further refined using the GNPS2 open web tools. Once the molecular networks were established, they were exported to Cytoscape 3.10.3 for advanced visualization, enabling a clear depiction of the structural connectivity and metabolomic relationships. Feature-based molecular networking demonstrated a diverse metabolic profile for the GK4 extract, highlighted by the widespread distribution of various amino acids (A1 cluster), coumarins (B6 cluster), and phenolics (B15 cluster) (Fig. 8). Specifically, a targeted compound eluting at a retention time of 23.36 minutes was successfully localized within a prominent and highly interconnected cluster of the FBMN network (Fig. 8). Within this cluster, a specific node designated with the shared name 5513 was identified. This node exhibited a characteristic fragment ion at m/z 287.0914, corresponding to the neutral loss of a water molecule [M + H − H2O]+. Therefore, the experimental data showed a match with the predicted component, which provides definitive support for the identification of the target compound in GK4 extract. The chromatogram reveals a chemically diverse array of metabolites eluted over a 32-minute gradient (Fig. 9A). The early eluting phase (1–7 min) is characterized by highly polar constituents, with prominent signals detected at 2.41 and 4.16 minutes. Subsequently, the region between 7.5 and 20.0 minutes displays an intermediate distribution of secondary metabolites with moderate lipophilicity. The final phase of the chromatographic profile is dominated by low-polarity (hydrophobic) compounds, the most striking feature of which is an exceptionally intense peak at 23.36 minutes. Although the early polar signals at 2.41 and 4.16 min, along with various intermediate metabolites eluting in the median range, are integral to the extract’s chemical complexity, they exhibit relatively modest abundances and likely offer a secondary contribution to the overall bio-functional activity. A major peak was observed at tR 23.36 minutes. This peak was distinguished from the surrounding minor peaks and background noise, designating it as the key bioactive marker of the GK4 extract. Consequently, this specific metabolite was prioritized for MS/MS fragmentation and molecular networking to facilitate its structural annotation and elucidate its potential role in the observed anti-colitic effects. It demonstrated a protonated molecular ion [M + H]+ at m/z 305.1019 in the HR-ESI-MS spectrum. This observed mass closely matches the theoretical value for C16H17O6 (calcd. m/z 305.1025) (Fig. 9B). The precursor ion underwent initial dehydration to produce a prominent fragment at m/z 287.0914 [M + H − H2O]+ (Fig. 9C). The loss of a water molecule from the hydroxyl moiety is a well-documented primary fragmentation step for coumarin derivatives.19 Moreover, the base peak at m/z 245.0808 originated from the neutral loss of an acetic acid moiety directly from the precursor ion, thereby providing evidence for the presence of an acetoxy substituent. Finally, the subsequent fragmentation of this ion yielded a secondary fragment at m/z 227.0703 via the additional elimination of water. This sequential loss of functional groups [M + H − CH3COOH − H2O]+ is in full agreement with the proposed pyranocoumarin scaffold.20,21 Based on the mass fragmentation patterns and spectral matching, the compound was tentatively identified as (9-hydroxy-8,8-dimethyl-2-oxo-9,10-dihydropyrano[2,3-f]chromen-10-yl) acetate, a derivative belonging to the coumarin framework.19
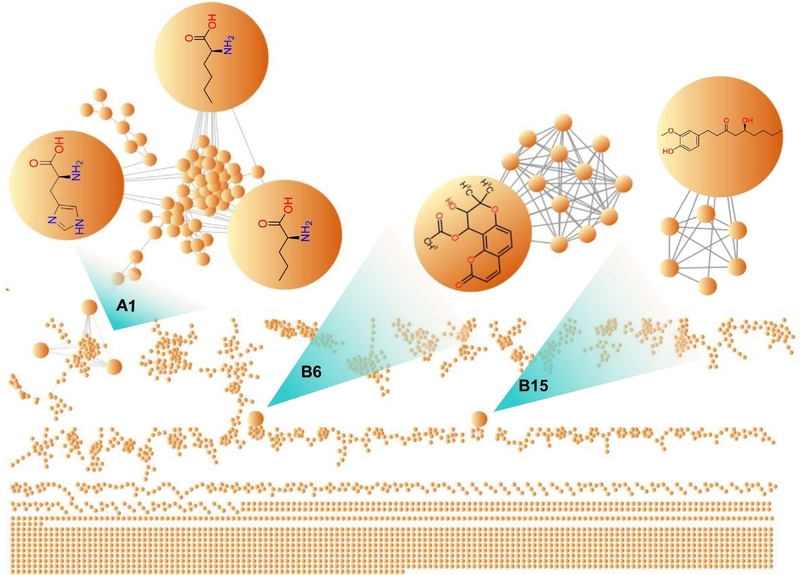
Molecular network analysis of compound annotations within the GK4 extract using GNPS-FBMN.
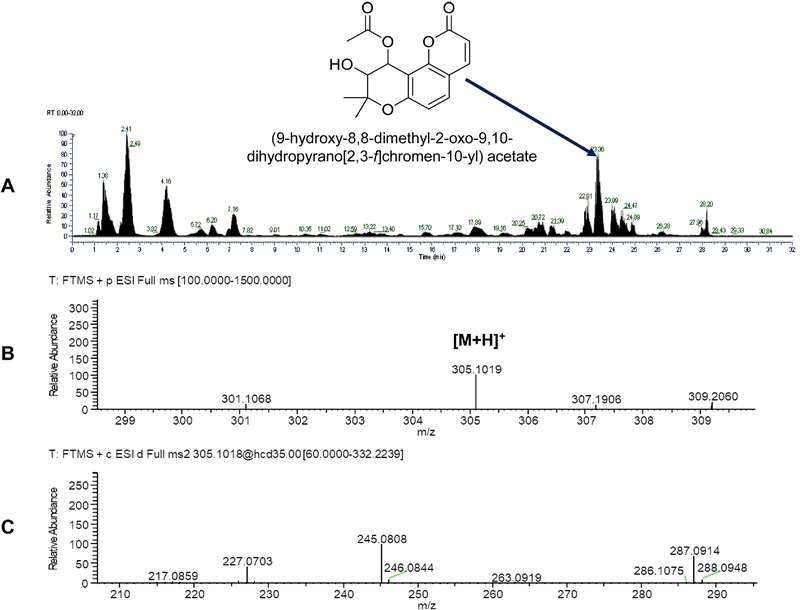
2D chromatogram, full MS, and MS2 fragmentation spectrum of the targeted compound (tR = 23.36 min) from GK4 extract.
Coumarin derivatives have emerged as a significant class of natural compounds with diverse pharmacological potential, particularly in the management of inflammatory bowel diseases.22 For example, it was recently demonstrated that isoimperatorin, a compound possessing a coumarin scaffold, effectively ameliorates ulcerative colitis by inducing Treg cell generation and promoting mucosal healing.23 Similarly, columbianadin, another coumarin-based derivative, exhibits potent anti-colitis and antioxidant effects by targeting the HO-1/Nrf2 and TLR4-NF-κB signaling pathways. This synergistic effect significantly attenuates oxidative stress-induced tissue damage and suppresses the nuclear translocation of NF-κB, thereby preventing the cascade of pro-inflammatory mediators in the colonic epithelium.24 Furthermore, praeruptorin A, which is a pyranocoumarin structurally analogous to the markers identified in our GK4 sample, alleviates DSS-induced acute colitis by modulating the STAT-1/-3 signaling pathways. In detail, praeruptorin A effectively suppresses the overproduction of pro-inflammatory cytokines and restores the balance of the intestinal immune microenvironment.25 In addition, this molecular regulation leads to a significant reduction in tissue damage and promotes the structural recovery of the colonic crypts, thereby preventing further disease progression.25 These findings provide a robust scientific basis for the therapeutic potential of the (9-hydroxy-8,8-dimethyl-2-oxo-9,10-dihydropyrano[2,3-f]chromen-10-yl) acetate identified in our study, suggesting that this compound is a major constituent responsible for the extract’s anti-inflammatory efficacy.
The potential anti-inflammatory activity was further validated via molecular docking, where binding affinities and interactions between the ligands and protein residues (IL-6, IL-1β, and IL-10) were calculated. These simulations provide computational evidence for the observed inhibitory effects, supporting the therapeutic potential of the identified structure. The docking simulations revealed that (9-hydroxy-8,8-dimethyl-2-oxo-9,10-dihydropyrano[2,3-f]chromen-10-yl) acetate exhibits strong binding interactions with all three targets (Fig. 10). The interaction with IL-6 showed the most favorable binding affinity (−8.73 kcal/ mol), which closely matches values reported for the reference inhibitor in previous studies (Fig. 10A).14 This compound forms conventional hydrogen bonds with residues ASN63, TYR97, and GLU93, complemented by a carbon-hydrogen bond with LEU64 and PRO65. Additionally, the aromatic core participates in π-σ and π-alkyl interactions with LEU147, providing hydrophobic reinforcement to the binding complex. A dense cloud of van der Waals forces involving VAL96, PRO139, ASN144, and THR143 surrounds the ligand, contributing to the overall stability of the protein-ligand complex through an optimal geometric fit within the binding cavity. For the IL-1β protein (PDB ID: 6Y8M), the targeted compound occupied the same binding pocket as the co-crystallized ligand. The targeted compound showed a binding free energy (ΔG = −4.84 kcal/mol) comparable to a redocked native ligand (ΔG = −5.60 kcal/mol) (Fig. 10B). Detailed interaction analysis was performed to elucidate the binding mode of the compound within the protein’s active site. The ligand establishes two conventional hydrogen bonds with the GLN149 and MET148 residues. Moreover, important interactions with ASN108, LYS109, LEU110, and THR147 further stabilize the overall docking pose. When (9-hydroxy-8,8-dimethyl-2-oxo-9,10-dihydropyrano[2,3-f]chromen-10-yl) acetate docked with the IL-10 protein, it exhibited a moderate binding affinity of −6.82 kcal/mol (Fig. 10C). Our simulations suggest that the compound is effectively stabilized within the binding pocket through a comprehensive hydrogen-bonding network. This network involves key hydrogen interactions with the residues ARG27, SER98, VAL99, ASP100, and ARG191. In addition to polar bonds, a significant cluster of van der Waals interactions involving residues PHE30, GLN38, SER72, ASN73, and GLY74 further stabilizes the compound in the hydrophobic regions of the IL-10 binding pocket. Overall, these docking results suggest that the compound possesses multi-target binding capacity involving several key inflammatory markers. The targeted compound effectively occupies the active sites of IL-6 and IL-1β as well as IL-10 to modulate the cytokine cascades. These interactions establish a promising molecular mechanism for colitis treatment.
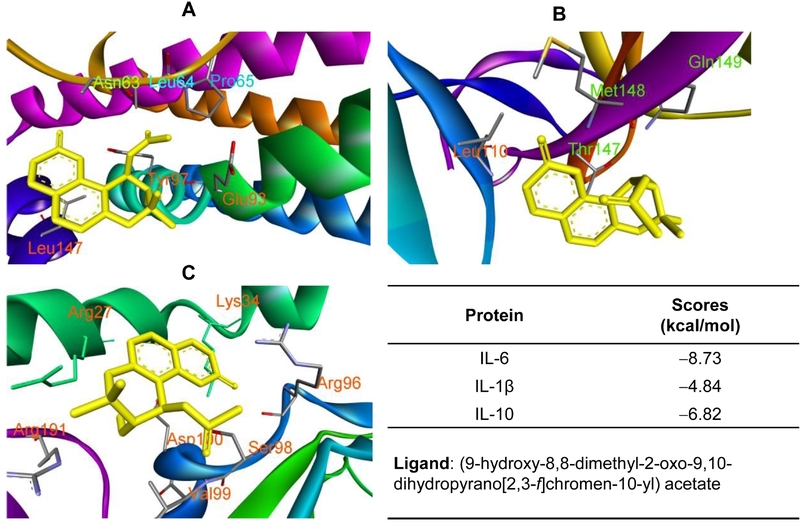
3D interactions of (9-hydroxy-8,8-dimethyl-2-oxo-9,10-dihydropyrano[2,3-f]chromen-10-yl) acetate with amino acid when they were docked into IL-6 (1ALU, A), IL-1β (6Y8M, B), and IL-10 (1J7V, C) proteins.
In summary, the findings of this study demonstrate that fermented products of B. rapa subsp. pekinensis effectively alleviate the physical manifestations of DSS-induced colitis. The data suggest that they prevent the hallmark symptoms of intestinal inflammation, specifically colon shortening and high DAI scores. At the molecular level, the protective mechanism of fermented products is driven by their ability to modulate the immune response. By significantly lowering the levels of IL-6 and IL-1β while maintaining or modulating IL-10, the fermented product treatment effectively “cooled” the cytokine storm induced by DSS. The sharp reduction in MPO activity further confirms that fermented products prevent the excessive recruitment of inflammatory cells into the colonic mucosa, thereby reducing tissue damage. Among them, fermented green tea products represent a promising functional food strategy for the management of IBD. The ability of these fermented products to maintain mucosal integrity and suppress systemic inflammation supports their potential as a dietary intervention to reduce the severity of chronic intestinal disorders.
Acknowledgments
This work was supported by the National Research Foundation of Korea (NRF) grant funded by the Korea government (MSIT) (grant number: RS-2022-NR070862). This research was also supported by Korea Basic Science Institute (National Research Facilities and Equipment Center) grant funded by the Korea government (MOE) (RS-2026-25533557) and by the BK21 FOUR (Fostering Outstanding Universities for Research, No. 2120260515565) funded by the MOE and NRF.
Conflicts of Interest
The authors declare that they have no conflicts of interest.
References
-
de Castro, M. M.; Pascoal, L. B.; Steigleder, K. M.; Siqueira, B. P.; Corona, L. P.; Ayrizono, M. d. L. S.; Milanski, M.; Leal, R. F. World J. Exp. Med. 2021, 11, 1–16.
[https://doi.org/10.5493/wjem.v11.i1.1]

-
Nagahori, M.; Nemoto, Y.; Watanabe, M. Intest. Res. 2010, 8, 9–17.
[https://doi.org/10.5217/ir.2010.8.1.9]
-
Bhattacharyya, A.; Chattopadhyay, R.; Mitra, S.; Crowe, S. E. Physiol. Rev. 2014, 94, 329–354.
[https://doi.org/10.1152/physrev.00040.2012]
-
Le, D. D.; Yu, S.; Dang, T.; Lee, M. Antioxidants 2023, 12, 1876.
[https://doi.org/10.3390/antiox12101876]
-
Bora, S. J.; Bhattacharyya, S.; Deb, S.; Sarkar, D. Phytochem. Rev. 2026, 25, 1985–2026.
[https://doi.org/10.1007/s11101-025-10188-5]
-
Park, K.-Y.; Jeong, J.-K.; Lee, Y.-E.; Daily, J. W. J. Med. Food 2014, 17, 6–20.
[https://doi.org/10.1089/jmf.2013.3083]
-
Wark, G.; Samocha-Bonet, D.; Ghaly, S.; Danta, M. Nutrients 2020, 13, 135.
[https://doi.org/10.3390/nu13010135]
-
Lee, M.-A.; Choi, Y.-J.; Kim, Y.-S.; Chon, S.-Y.; Chung, Y. B.; Park, S.-H.; Yun, Y.-R.; Min, S. G.; Yang, H.-C.; Seo, H.-Y. Heliyon 2022, 8, e11360.
[https://doi.org/10.1016/j.heliyon.2022.e11360]
-
Zhao, D.; Shah, N. P. J. Funct. Foods 2016, 20, 182–194.
[https://doi.org/10.1016/j.jff.2015.10.033]
-
Chassaing, B.; Aitken, J. D.; Malleshappa, M.; Vijay-Kumar, M. Curr. Protoc. Immunol. 2014, 104, 15.25.1–15.25.14.
[https://doi.org/10.1002/0471142735.im1525s104]
- Perše, M.; Cerar, A. J. Biomed. Biotechnol. 2012, 2012, 718617.
-
De Fazio, L.; Spisni, E.; Cavazza, E.; Strillacci, A.; Candela, M.; Centanni, M.; Ricci, C.; Rizzello, F.; Campieri, M.; Valerii, M. C. Front. Pharmacol. 2016, 7, 38.
[https://doi.org/10.3389/fphar.2016.00038]
-
Josephson, K.; Logsdon, N. J.; Walter, M. R. Immunity 2001, 15, 35–46.
[https://doi.org/10.1016/S1074-7613(01)00169-8]
-
Choi, J.; Le, D. D.; Roh, N.; Lee, J.; Shrestha, D.; Dinh, T.; Truong, V.; Bazarragchaa, B.; Kim, S.-Y.; Suh, S.-S.; Lee, M.; Seo, J. B. Pharmaceuticals 2025, 18, 150.
[https://doi.org/10.3390/ph18020150]
-
Yan, Y.; Kolachala, V.; Dalmasso, G.; Nguyen, H.; Laroui, H.; Sitaraman, S. V.; Merlin, D. PLoS One 2009, 4, e6073.
[https://doi.org/10.1371/journal.pone.0006073]
-
Juhn, S. K.; Jung, M.-K.; Hoffman, M. D.; Drew, B. R.; Preciado, D. A.; Sausen, N. J.; Jung, T. T.; Kim, B. H.; Park, S. Y.; Lin, J.; Ondrey, F. G.; Mains, D. R.; Huang, T. Clin. Exp. Otorhinolaryngol. 2008, 1, 117–138.
[https://doi.org/10.3342/ceo.2008.1.3.117]
-
Lee, C. G.; Homer, R. J.; Cohn, L.; Link, H.; Jung, S.; Craft, J. E.; Graham, B. S.; Johnson, T. R.; Elias, J. A. J. Biol. Chem. 2002, 277, 35466–35474.
[https://doi.org/10.1074/jbc.M206395200]
-
Itzkowitz, S. H.; Yio, X. Am. J. Physiol. Gastrointest. Liver Physiol. 2004, 287, G7–G17.
[https://doi.org/10.1152/ajpgi.00079.2004]
-
Tao, Y.; Luo, J.; Lu, Y.; Xu, D.; Hou, Z.; Kong, L. Nat. Prod. Commun. 2009, 4, 1079–1084.
[https://doi.org/10.1177/1934578X0900400812]
-
Hou, Z.; Xu, D.; Yao, S.; Luo, J.; Kong, L. J. Chromatogr. B Analyt. Technol. Biomed. Life Sci. 2009, 877, 2571–2578.
[https://doi.org/10.1016/j.jchromb.2009.06.042]
-
Song, Y.-L.; Jing, W.-H.; Yan, R.; Wang, Y.-T. J. Pharm. Biomed. Anal. 2014, 90, 98–110.
[https://doi.org/10.1016/j.jpba.2013.10.010]
-
Di Stasi, L. C. Molecules 2021, 26, 422.
[https://doi.org/10.3390/molecules26020422]
-
Fang, Y.; Min, S.; Chen, H.; Zhu, Z.; Li, Y.; Tong, Y.; Hu, J.; Zhu, L.; Shen, H. Mol. Med. 2025, 31, 275.
[https://doi.org/10.1186/s10020-025-01334-y]
-
Zhang, Y.; Cao, P.; Qin, D.; Zhao, Y.; Chen, X.; Ma, P. Inflammopharmacology 2025, 33, 341–352.
[https://doi.org/10.1007/s10787-024-01630-9]
-
Yu, P.-J.; Ci, W.; Wang, G.-F.; Zhang, J.-Y.; Wu, S.-Y.; Xu, W.; Jin, H.; Zhu, Z.-G.; Zhang, J.-J.; Pang, J. X.; Wu, S.-G. Phytother. Res. 2011, 25, 550–556.
[https://doi.org/10.1002/ptr.3295]